Sunday, December 31, 2006

Best of Fat Knowledge 2006

The most popular and/or my favorite posts of 2006:

Read More...

Saturday, December 23, 2006

See You Next Year

I am going to be away from the blogging for a little while.

Have a Merry Christmas and a Happy New Year.

Read More...

GPA: Discipline vs. IQ

Duckworth studied 164 eighth-grade students in Philadelphia, tracking each child’s I.Q. as well as his or her score on a test that measured self-discipline and then correlating those two numbers with the student’s G.P.A. Surprisingly, she found that the self-discipline scores were a more accurate predictor of G.P.A. than the I.Q. scores by a factor of two.

Duckworth’s paper connects with a new wave of research being done around the country showing that “noncognitive” abilities like self-control, adaptability, patience and openness — the kinds of qualities that middle-class parents pass on to their children every day, in all kinds of subtle and indirect ways — have a huge and measurable impact on a child’s future success.
Interesting. Teaching these "noncognitive" skills might be more important than teaching the 3 Rs.

via NY Times Magazine

Read More...

What It Takes to Make a Student

Great article in the NY Times Magazine taking a look at why rich kids do better than poor kids at school and what can be done about it.

There had, in fact, been evidence for a long time that poor children fell behind rich and middle-class children early, and stayed behind. But researchers had been unable to isolate the reasons for the divergence. Did rich parents have better genes? Did they value education more? Was it that rich parents bought more books and educational toys for their children? Was it because they were more likely to stay married than poor parents? Or was it that rich children ate more nutritious food? Moved less often? Watched less TV? Got more sleep? Without being able to identify the important factors and eliminate the irrelevant ones, there was no way even to begin to find a strategy to shrink the gap.
They found, first, that vocabulary growth differed sharply by class and that the gap between the classes opened early. By age 3, children whose parents were professionals had vocabularies of about 1,100 words, and children whose parents were on welfare had vocabularies of about 525 words. The children’s I.Q.’s correlated closely to their vocabularies. The average I.Q. among the professional children was 117, and the welfare children had an average I.Q. of 79.

By comparing the vocabulary scores with their observations of each child’s home life, they were able to conclude that the size of each child’s vocabulary correlated most closely to one simple factor: the number of words the parents spoke to the child. That varied greatly across the homes they visited, and again, it varied by class. In the professional homes, parents directed an average of 487 “utterances” — anything from a one-word command to a full soliloquy — to their children each hour. In welfare homes, the children heard 178 utterances per hour.

By age 3, the average child of a professional heard about 500,000 encouragements and 80,000 discouragements. For the welfare children, the situation was reversed: they heard, on average, about 75,000 encouragements and 200,000 discouragements.

Hart and Risley showed that language exposure in early childhood correlated strongly with I.Q. and academic success later on in a child’s life. Children from more well-off homes tend to experience parental attitudes that are more sensitive, more encouraging, less intrusive and less detached — all of which, they found, serves to increase I.Q. and school-readiness.

Their work also suggests that the disadvantages that poverty imposes on children aren’t primarily about material goods. True, every poor child would benefit from having more books in his home and more nutritious food to eat (and money certainly makes it easier to carry out a program of concerted cultivation). But the real advantages that middle-class children gain come from more elusive processes: the language that their parents use, the attitudes toward life that they convey.
So there is the issue. Children are raised differently and this carries over into the classroom. You can't give the same kind of education to poor kids and expect them to have equal results. So, what can be done to give them a chance? One charter school has found some things that work.
First, they require many more hours of class time than a typical public school. The school day starts early, at 8 a.m. or before, and often continues until after 4 p.m. These schools offer additional tutoring after school as well as classes on Saturday mornings, and summer vacation usually lasts only about a month. The schools try to leaven those long hours with music classes, foreign languages, trips and sports, but they spend a whole lot of time going over the basics: reading and math.

Second, they treat classroom instruction and lesson planning as much as a science as an art. Explicit goals are set for each year, month and day of each class, and principals have considerable authority to redirect and even remove teachers who aren’t meeting those goals. The schools’ leaders believe in frequent testing, which, they say, lets them measure what is working and what isn’t, and they use test results to make adjustments to the curriculum as they go. Teachers are trained and retrained, frequently observed and assessed by their principals and superintendents. There is an emphasis on results but also on “team building” and cooperation and creativity, and the schools seem, to an outsider at least, like genuinely rewarding places to work, despite the long hours. They tend to attract young, enthusiastic teachers, including many alumni of Teach for America, the program that recruits graduates from top universities to work for two years in inner-city public schools.

Third, they make a conscious effort to guide the behavior, and even the values, of their students by teaching what they call character. Using slogans, motivational posters, incentives, encouragements and punishments, the schools direct students in everything from the principles of teamwork and the importance of an optimistic outlook to the nuts and bolts of how to sit in class, where to direct their eyes when a teacher is talking and even how to nod appropriately.
The whole article is full of really interesting ideas, I would recommend reading it all.

Read More...

Friday, December 22, 2006

My New Favorite Government Program Name

The San Joaquin Valley has been described as “California's Appalachia”, but that label is almost too flattering. The valley is as poor as the federally defined Central Appalachian Region, which comprises the poorest parts of Virginia, West Virginia, Tennessee and Kentucky, and has a higher proportion of households on public assistance. One county is so plagued by unemployment that it pays impoverished families to leave the Central Valley, under a programme called More Opportunity for Viable Employment (MOVE).
Subtle.

via The Economist

Read More...

Science Points the Way to Happiness

While books on happiness abound, very little research has been done on how people become happier. In fact, many researchers have considered that quest to be futile. But recent long-term studies have revealed that the happiness thermostat is more malleable than the popular theory maintained. One easy way that sounds almost trite but has actually been shown to work? Every night, think of three good things that happened that day. Another proven exercise: identify five of your strengths and apply one strength in a new way every day for a week.
via Dallas Morning News via DailyGood

Read More...

Happiness: Good for Creativity, Bad for Single-Minded Focus

In one test, participants in a happy mood were better able to come up with a word that unified three other seemingly disparate words, such as "mower," "atomic" and "foreign." Solving the puzzle required participants to think creatively, moving beyond the normal word associations--"lawn," "bomb" and "currency"--to come up with the more remote answer: "power."

Interestingly, induced happiness made the subjects worse at the second task, which required them to ignore distractions and focus on a single piece of information. Participants had to identify a letter flashed on a computer screen flanked by either the same letter, as in the string "N N N N N," or a different letter, as in "H H N H H." When the surrounding letters didn't match, the happy participants were slower to recognize the target letter in the middle, indicating that the ringers distracted them.

The results suggest that an upbeat mood makes people more receptive to information of all kinds, says psychologist Adam Anderson, co-author of the study published online by Proceedings of the National Academy of Sciences USA.
via SciAm

Read More...

Saturday, December 16, 2006

Learning to Keep Learning

Tom Friedman takes a look at what needs to happen in our educational system.

Tomorrow, Mr. Tucker’s organization is coming out with a report titled “Tough Choices or Tough Times,” which proposes a radical overhaul of the U.S. education system, with one goal in mind: producing more workers — from the U.P.S. driver to the software engineer — who can think creatively.

“One thing we know about creativity is that it typically occurs when people who have mastered two or more quite different fields use the framework in one to think afresh about the other,” said Mr. Tucker. Thus, his report focuses on “how to make that kind of thinking integral to every level of education.”

That means, he adds, revamping an education system designed in the 1900s for people to do “routine work,” and refocusing it on producing people who can imagine things that have never been available before, who can create ingenious marketing and sales campaigns, write books, build furniture, make movies and design software “that will capture people’s imaginations and become indispensable for millions.”
I like that definition of creativity. Not sure what it means in terms of remaking schools though.


via NY Times $elect

Read More...

Thursday, December 14, 2006

Marshmallows and Public Policy

Around 1970, Walter Mischel launched a classic experiment. He left a succession of 4-year-olds in a room with a bell and a marshmallow. If they rang the bell, he would come back and they could eat the marshmallow. If, however, they didn't ring the bell and waited for him to come back on his own, they could then have two marshmallows.

The children who waited longer went on to get higher SAT scores. They got into better colleges and had, on average, better adult outcomes. The children who rang the bell quickest were more likely to become bullies. They received worse teacher and parental evaluations 10 years on and were more likely to have drug problems at age 32.

The ability to delay gratification, like most skills, correlates with socioeconomic status and parenting styles. Children from poorer homes do much worse on delayed gratification tests than children from middle-class homes.

What works, says Jonathan Haidt, the author of "The Happiness Hypothesis," is creating stable, predictable environments for children, in which good behavior pays off — and practice. Young people who are given a series of tests that demand self-control get better at it over time.
In makes you wonder about what skills should be taught in school. If delaying gratification correlates with more success in school and in life, and if it can be taught seems like it should be.

I was reading in Happiness and Economics that education is not correlated with happiness. How strange is it that we spend all this time getting educated and yet on average it doesn't increase happiness?

I also happened to have just read the Happiness Hypothesis book mentioned, and I would highly recommend it. Lots of interesting stuff in it.

via NY Times $elect

Read More...

Energy Opportunity Cost of Agriculture

I was reading this interesting report on Life Cycle-Based Sustainability Indicators for Assessment of the U.S. Food System and the graph to the left caught my eye (click for larger version). Basically it shows that the US is creating 1.4 quads of food energy, but it takes an additional 10.2 quads of energy in the form of fossil fuels to produce, transport, process, package and cook the food. For every calorie of food we consume it takes 7.2 times as much energy in fossil fuels to put it on the table.

Looks like we are using a lot of energy in order to produce our food. But, what if we looked at it slightly differently. What if we looked at the energy opportunity cost of agriculture. What if we say, used the land to produce energy via solar panels, how much energy could we produce?

From the USDA, we find that there are 302 million acres of harvested cropland. From Google Calculator we find that this is equal to 1.2 × 10^12 square meters.

At Wikipedia we find that most parts of the US get 4.5kWh/m2/day of solar radiation a day or 1,642.5 kWh/yr.

Lets assume that the solar panels are 10% efficient (although scientists have just made 40% efficient ones).

If all harvested cropland had solar panels instead, they would capture:
1,642.5 kWh/yr * 10% efficient * 1.2 × 10^12 m^2 = 1.97 x 10^14 kWh.

Via Google calculator again we find that this equals 6.72 × 10^17 BTU or 672 quads of energy. That is 480 times as much as the 1.4 quads of energy in our food, and 66 times as much as the 10.4 quads of energy to produce, transport, process, package and cook the food.
Note: the calories in the food is based on what we eat rather than what we produce, so the 480 times ratio is probably on the high side as the US exports a lot of food. When I was comparing solar panels with sugar cane earlier I got a ratio of 50 to 1. Average caloric yield per acre in the US is much lower than that of sugar cane, but I don't know if it is just 1/10.

While it might appear that we are using lots of energy in order to produce our food, in fact the much bigger loss is the amount of energy that we could have produced had we put solar cells on the land.

It might seem that going organic would help to use less energy, as you won't use energy to create fertilizer. But, as we have seen here, organic farming tends to use more land than conventional farming (in this case by around 50%). Based on the numbers above, if you could switch from organic to conventional and decrease the amount of land you use by just 1.5%, you could put solar panels on that land and generate more energy than is used producing, transporting, processing, packaging and cooking the food (still assuming it takes 7 times as much energy as in the food). Free up 3% of the land and you have doubled the amount of energy. From an energy opportunity cost standpoint, it is not the fossil fuels that are expensive, it is the crops inability to capture much solar energy on the land that is expensive.

The one issue with this analysis is that in the short run (say 15 years) solar power will not economical and few would replace crop land with solar panels. Also, while fertilizer could be made from solar energy, currently it is not really possible to distribute the food using electric vehicles. So, in the short run does it make sense to buy organic now to try and reduce fossil fuel usage?

This is a tough choice. You are basically choosing between using more land or using more fossil fuels. By reducing the amount of land needed this protects forests from being turned into farmland or allows old farmland to become forest again. On the other hand by reducing fossil fuel usage it helps with global warming, air pollution and resource wars. I think I would go with reducing land usage, but I could understand those that went the other direction as well.

Read More...

Food Politics

The Economist has a couple of really interesting articles looking at organic, fair trade and buying local (free one, subscription one). Basically they question whether these really are better for the environment and workers. I summarize below but the whole articles are worth a read.

On organics:

But not everyone agrees that organic farming is better for the environment. Perhaps the most eminent critic of organic farming is Norman Borlaug, the father of the “green revolution”, winner of the Nobel peace prize and an outspoken advocate of the use of synthetic fertilisers to increase crop yields. He claims the idea that organic farming is better for the environment is “ridiculous” because organic farming produces lower yields and therefore requires more land under cultivation to produce the same amount of food. Thanks to synthetic fertilisers, Mr Borlaug points out, global cereal production tripled between 1950 and 2000, but the amount of land used increased by only 10%. Using traditional techniques such as crop rotation, compost and manure to supply the soil with nitrogen and other minerals would have required a tripling of the area under cultivation. The more intensively you farm, Mr Borlaug contends, the more room you have left for rainforest.
When I was able to get a hold of numbers, organic farming used on average 50% more land. If you like rainforests, think twice on organic foods.

On Fairtrade:
Fairtrade food is designed to raise poor farmers' incomes. It is sold at a higher price than ordinary food, with a subsidy passed back to the farmer. But prices of agricultural commodities are low because of overproduction. By propping up the price, the Fairtrade system encourages farmers to produce more of these commodities rather than diversifying into other crops and so depresses prices—thus achieving, for most farmers, exactly the opposite of what the initiative is intended to do.
There is also the issue that there is more Fairtrade coffee produced than purchased, so who determines who gets the higher prices? I like the concept of paying a nickel more for a cup of coffee in order to allow the workers to make a higher wage, but I am not sure it is that simple.

On buying local:
Surely the case for local food, produced as close as possible to the consumer in order to minimise “food miles” and, by extension, carbon emissions, is clear? Surprisingly, it is not. A study of Britain's food system found that nearly half of food-vehicle miles (ie, miles travelled by vehicles carrying food) were driven by cars going to and from the shops. Most people live closer to a supermarket than a farmer's market, so more local food could mean more food-vehicle miles. Moving food around in big, carefully packed lorries, as supermarkets do, may in fact be the most efficient way to transport the stuff.

What's more, once the energy used in production as well as transport is taken into account, local food may turn out to be even less green. Producing lamb in New Zealand and shipping it to Britain uses less energy than producing British lamb, because farming in New Zealand is less energy-intensive. And the local-food movement's aims, of course, contradict those of the Fairtrade movement, by discouraging rich-country consumers from buying poor-country produce.
I wrote about the energy issue before in my Buy Local vs. Shop Local post and came to a similar conclusion. I also think that there is just as strong of a moral case for buying global than local.

So what is their conclusion?
So what should the ethically minded consumer do? Things that are less fun than shopping, alas. Real change will require action by governments, in the form of a global carbon tax; reform of the world trade system; and the abolition of agricultural tariffs and subsidies, notably Europe's monstrous common agricultural policy, which coddles rich farmers and prices those in the poor world out of the European market. Proper free trade would be by far the best way to help poor farmers. Taxing carbon would price the cost of emissions into the price of goods, and retailers would then have an incentive to source locally if it saved energy. But these changes will come about only through difficult, international, political deals that the world's governments have so far failed to do.

The best thing about the spread of the ethical-food movement is that it offers grounds for hope. It sends a signal that there is an enormous appetite for change and widespread frustration that governments are not doing enough to preserve the environment, reform world trade or encourage development. Which suggests that, if politicians put these options on the political menu, people might support them.
While I agree that a carbon tax and freeing up the agricultural markets are good, I am not so sure that 'voting with your pocketbook' doesn't still make sense. It isn't the concept that is off, it is the implementation. Instead of organic, why not have an Acres and Gallons label, so you can take into account both land usage and energy usage? The issue is that the actual implementation of organic farming might not be the best for the environment, not that paying more for environmentally responsible foods doesn't work.

Read More...

Wednesday, December 13, 2006

Best Quote On Milton Friedman

From An Infuriating Man:

His friends, it is true, tend to have strong nerves and read statistics the way some men read pornography.
Here at Fat Knowledge, we too are looking for friends that read stats like porn, but in homage to Milton, you are free to choose.

For you stat lovers check out Swivel. For the rest of you, digg has a listing of all Playboy "Playmates of the Month" from January 1954 to December 2003.

Read More...

DNA Gatherers Hit Snag: Tribes Don’t Trust Them

The National Geographic Society’s multimillion-dollar research project to collect DNA from indigenous groups around the world in the hopes of reconstructing humanity’s ancient migrations has come to a standstill on its home turf in North America.

Billed as the “moon shot of anthropology,” the Genographic Project intends to collect 100,000 indigenous DNA samples. But for four months, the project has been on hold here as it scrambles to address questions raised by a group that oversees research involving Alaska natives.
I am a big fan of this Genographic Project, which I blogged on earlier.

Aside: If you are looking for a last minute gift, I think it is pretty cool (not to mention that if you give it to your mother and father you are finding out where you came from, even though it is their gift ;)). The one thing is that if you have European ancestry, don't expect to learn much as they don't have many different branches of Europeans. But the money still goes to support the project so it is still worthwhile.

It is disappointing to me that the Native Americans are taking this stand. Why are they refusing to take part?
At issue is whether scientists who need DNA from aboriginal populations to fashion a window on the past are underselling the risks to present-day donors. Geographic origin stories told by DNA can clash with long-held beliefs, threatening a world view some indigenous leaders see as vital to preserving their culture.

Some American Indians trace their suspicions to the experience of the Havasupai Tribe, whose members gave DNA for a diabetes study that University of Arizona researchers later used to link the tribe’s ancestors to Asia. To tribe members raised to believe the Grand Canyon is humanity’s birthplace, the suggestion that their own DNA says otherwise was deeply disturbing.
I hate it when religious/traditional beliefs stop science. I really like what the Dalai Lama has said on this subject: If science proves some belief of Buddhism wrong, then Buddhism will have to change. Why can't other religious leaders come to the same conclusion?

Any other reasons they have?
Scientific evidence that American Indians or other aboriginal groups came from elsewhere, they say, could undermine their moral basis for sovereignty and chip away at their collective legal claims.

“What if it turns out you’re really Siberian and then, oops, your health care is gone?” said Dr. David Barrett, a co-chairman of the Alaska Area Institutional Review Board, which is sponsored by the Indian Health Service, a federal agency. “Did anyone explain that to them?”
If those were true, then I could understand their argument. But I just don't get it. How could this undermine the moral or legal basis for their sovereignty? And why would they lose their health insurance if it turns out they came from Siberia? This just seems nutty to me.

The International Indian Treaty Council wrote up a list of their issues with the Genographic Project in this UN document. They have lots of arguments as to why they are opposed, most of which are summarized above. I wanted to respond to one of their points.
RECOGNIZING that Indigenous Peoples have extensive traditional knowledge and oral histories about our own origins, which are central to our spiritual and cultural identity and are valid on their own right and do not need western scientific validation;
I already wrote why the religious aspect of this concerns me. But the other thing that concerns me is that they call it "western scientific validation". Science is science, there is no western science (which I assume means there is also an eastern science). Something like 50% of all graduate students in the sciences in the US come from India and China. The Aztec and Mayan civilizations had advanced scientific understandings for their time. For the Native Americans to try and belittle science as something foreign and therefore not to be trusted, rather than try and be active participants of the scientific community is very disappointing.

via NY Times

Read More...

Weight of All People on the Earth

After reading that meat and dairy animals now account for about 20% of all terrestrial animal biomass, I became curious how they calculated that. Taking a look at the document, they attribute it to this report done back in 1979. Thanks to the wonders of the internet and cheap outsourcing to M S Swaminathan Research Foundation, in Chennai, India, we are all able to read that original report.

The calculation is done in this section on animal biomass which attributes to another article written in 1973. Man, I would have thought someone would have come up with a better estimate in the last 30 years, but whatever.

They figure the average weight of a human is 50kg (I wonder if that has changed since 1979?), so assuming there are 6.5 billion humans alive today that gets you to 325 billion kg.

Of course you are now wondering, how does that compare with the weight of all other animals on the planet? Glad you asked.

For some reason they like to compare in dry weight. A human is 70% water, so this gets you down to 97.5 bil kg. And they like to measure things in grams using scientific notation so that puts you at 97.5 x 10^12 g. They put total animal biomass at 2002 x 10^12 g dry weight and 1005 x 10^12 g for terrestrial ecosystems, so humans make up just about 5% of all animal biomass and 10% of all land animal biomass.

The UN report estimated that all livestock weigh .7 billion tonnes or 700 billion kg. This is a little over 2 times as much as humans (and makes you wonder who the dominant species on earth is). Assuming they have the same amount of water, that would put them at 20% of all land animal biomass and humans and livestock combined put as at 30% of all terrestrial biomass. That is pretty high, but nowhere near the 98% of all terrestrial vertebrates that Daniel C. Dennett wrote about.

The underlying assumptions on how the total biomass was calculated in this report is not clear, and things may have changed since 1973. I would really be interested to see an updated version of these numbers.

Read More...

Why a Hydrogen Economy Doesn't Make Sense

In a recent study, fuel cell expert Ulf Bossel explains that a hydrogen economy is a wasteful economy. The large amount of energy required to isolate hydrogen from natural compounds (water, natural gas, biomass), package the light gas by compression or liquefaction, transfer the energy carrier to the user, plus the energy lost when it is converted to useful electricity with fuel cells, leaves around 25% for practical use — an unacceptable value to run an economy in a sustainable future. Only niche applications like submarines and spacecraft might use hydrogen.

Also, Bossel found that the output-input efficiency cannot be much above 30%, while advanced batteries have a cycle efficiency of above 80%. In every situation, Bossel found, the energy input outweighs the energy delivered by a factor of three to four.
In general I agree with what he is saying here and that chart gives a good run down on the amount of energy lost from the power plant to the car. If the energy you are using is from solar cells or wind, using a battery powered car is much more efficient than converting the electricity into hydrogen to run a fuel cell car. As he states in the article we should be focusing on an electron economy rather than a hydrogen economy.

via physorg.comv

Read More...

Tuesday, December 12, 2006

Farmers Raise Stink over New Zealand 'Fart Tax'

This follows up on the last post.

Farmers blocked the streets of New Zealand's capital, Wellington, yesterday in protest at plans to impose the world's first "fart tax" on livestock flatulence.

Nicknamed the "back-door tax", the levy is intended to fund research into reducing the 37m tonnes of methane blown off each year by New Zealand's sheep, cattle and deer. Four hundred farmers with 20 tractors rallied outside parliament. An opposition MP led a cow named Energy up the steps of the building.

Wind from New Zealand's 30m sheep, 10m cattle and 2m deer accounts for 60% of greenhouse gas emissions, well ahead of industries such as transport and electricity generation.

A petition against the policy - which is likely to cost the average farmer NZ$300 (£110) a year - has gained more than 64,000 signatures, equal to nearly half of all New Zealand farmers.
I think these farmers are missing out. There is value in them there farts. I calculate that a cow emits $15 worth of methane a year. In case you don't know, methane is just another name for natural gas, and in this case we really are talking about natural gas.

As you might have expected the name "fart tax" is a little bit misleading.
Despite the proposed levy being dubbed the "fart tax", more than 90% of livestock methane comes from burping, rather than flatulence.
via The Guardian

Read More...

Global Livestock Sector Generates More GHG Emissions than Transport

According to a report published by the United Nations Food and Agriculture Organization, the livestock sector generates more greenhouse gas (GHG) emissions as measured in CO2 equivalent—18%—than transport. It is also a major source of land and water degradation.

Livestock now use 30% of the earth’s entire land surface, mostly permanent pasture but also including 33% of the global arable land used to producing feed for livestock, the report notes. As forests are cleared to create new pastures, it is a major driver of deforestation, especially in Latin America where, for example, some 70% of former forests in the Amazon have been turned over to grazing.

Meat and dairy animals now account for about 20% of all terrestrial animal biomass.

Global meat production is projected to more than double from 229 million tonnes in 1999/2001 to 465 million tonnes in 2050, while milk output is set to climb from 580 to 1043 million tonnes.

The global livestock sector is growing faster than any other agricultural sub-sector. It provides livelihoods to about 1.3 billion people and contributes about 40% to global agricultural output. For many poor farmers in developing countries livestock are also a source of renewable energy for draft and an essential source of organic fertilizer for their crops.
That is amazing to me that livestock use 30% of the Earth's surface and meat and dairy animals account for 20% of all terrestrial animal biomass.

I had written before on Cars vs. Cows and based on the numbers I found thought that cows had the bigger impact. Glad to see that this study agrees with that conclusion.

via Green Car Congress

Read More...

What keeps interest rates low? Foreign investment

In 1978, foreigners held about $39 billion worth of Treasury bonds, a modest 12 percent of the Treasuries in circulation, according to the authors. By the summer of 2005, foreign Treasury holdings were just shy of $1.6 trillion, nearly 52 percent of the value of all Treasuries. China, Japan and Hong Kong are the big buyers.

Were it not for foreign investment, the authors say, interest rates on the key 10-year U.S. Treasury note would be nearly one percentage point higher than they are.

And if foreign investors unloaded the mammoth holdings they already have, the 10-year rate would be about two percentage points higher than it is, they say.

If that happened, monthly payments on a standard 30-year mortgage might be 30 percent higher.
No wonder China doesn't want to revalue their currency. They would lose money on all of the T-Bills they own. Amazing that over 50% of the Treasuries are owned by foreigners.

via Seattle Times

Read More...

Suicide Bombing Ant

Camponotus saundersi, an ant species found in Malaysia, also has a very interesting defense. The colony is divided up into different functional groups, one of which is soldier ants. These soldiers are charged with defending the colony at all costs. If battle ensues, these ants will actually self-destruct. They have two large glands that run the entire length of their body, and when they become stressed the ant contracts its abdominal muscles causing the glands to explode, spraying poison in all directions.
Who knew?

via Wikipedia

Read More...

Thursday, December 07, 2006

Interesting Articles of the Week

13 things that do not make sense scientifically.

Boys and girls tend to use different parts of their brains to process some basic aspects of grammar.

Free services to inspire your cellphone.

Inside America's $37 billion prison economy.

Read More...

Wednesday, December 06, 2006

New World Record Achieved in Solar Cell Technology

U.S. Department of Energy (DOE) Assistant Secretary for Energy Efficiency and Renewable Energy Alexander Karsner today announced that with DOE funding, a concentrator solar cell produced by Boeing-Spectrolab has recently achieved a world-record conversion efficiency of 40.7 percent, establishing a new milestone in sunlight-to-electricity performance. This breakthrough may lead to systems with an installation cost of only $3 per watt, producing electricity at a cost of 8-10 cents per kilowatt/hour, making solar electricity a more cost-competitive and integral part of our nation’s energy mix.
Good news on the solar energy front. If this does lead to $3/watt installation costs and 8-10 cent per kWh power, that is big.
Reaching 40 percent efficiency helps further President Bush’s Solar America Initiative (SAI) goals, which aims to win nationwide acceptance of clean solar energy technologies by 2015. By then, it is intended that America will have enough solar energy systems installed to provide power to one to two million homes, at a cost of 5 to 10 cents per kilowatt/hour. The SAI is also key component of President Bush’s Advanced Energy Initiative, which provides a 22 percent increase in research and development funding at DOE and seeks to reduce our dependence on foreign sources of oil by changing the way we power our cars, homes and businesses.
Hmm, never heard of this Solar America Initiative before. I like the fact it is investing $148 million dollar in solar R&D in 2007. Hopefully it will allow more breakthroughs like this in the future, as solar is the long term energy solution.

Over at Slashdot they note how much land it would take to power the whole world with solar cells:
At 40% efficiency, it looks like a square 265 miles on a side in the American southwest would do it.
Time to start buying up land in New Mexico.

via Department of Energy

Read More...

National Geographic Best Wildlife Photos of 2006


via National Geographic

Read More...

Swivel

Swivel Co-founders Dmitry Dimov and Brian Mulloy start off by describing their company as “YouTube for Data.” That’s a good start for someone trying to understand it, because the site allows users to upload data - any data - and display it to other users visually. The number of page views your website generates. Or a stock price over time. Weather data. Commodity prices. The number of Bald Eagles in Washington state. Whatever. Uploaded data can be rated, commented and bookmarked by other users, helping to sort the interesting (and accurate) wheat from the chaff. And graphs of data can be embedded into websites. So it is in fact a bit like a YouTube for Data.

But then the real fun begins. You and other users can then compare that data to other data sets to find possible correlation (or lack thereof). Compare gas prices to presidential approval ratings or UFO sightings to iPod sales. Track your page views against weather reports in Silicon Valley. See if something interesting occurs.
I am stoked, can't wait for this to launch. The Freakonomics boys are looking forward to it as well.

via TechCrunch

Read More...

Spending Inequality vs. Income Inequality

An interesting article looking at how spending inequality in the US is much lower than income inequality.

Last year Americans in the lowest income quintile spent an average of $11,247 per person, according to the Bureau of Labor Statistics, compared with $15,843 for middle income quintiles, and $28,272 for the top quintile. The top group is spending only 2.5 times as much as the bottom group, and 1.8 times as much as the middle classes. This is not major inequality.
I agree that spending makes more sense to look at than income when talking about inequality, and adjusting the numbers per person rather than per household makes sense too. I don't know what classifies as 'major inequality', but the 2.5 ratio is much less than the 15.3 time difference in income.

Income inequality has gone up greatly over the last 20 years. What about spending inequality?
The lowest quintile is spending 14% more in 2005 than it was in 1985, the second quintile 16%, the third quintile 11%, the fourth 13%, and the top quintile is spending an additional 16%.
Doesn't look like it has changed much at all.

Aside from tax payments and transfer receipts, why is spending inequality per person less than many popular measures of income inequality?
The average number of people for a household in the lowest quintile is 1.7. It increases to 2.5 people for the middle quintile and reaches 3.2 people for the highest quintile.
I was surprised to find out that there was that much difference in number of people in a household between income quintiles. Which really reflects poorly on me because I have looked at this data set before. :)

So how much difference is there in the way that the rich and poor spend their money?
The differences between per person spending are even smaller for food and housing. Those in the top 20% of income earners spend $3,141 on food per person and those at the bottom 20% spend $1,792, i.e. the top group spends less than twice as much. For housing, the lowest spends about half as much as the highest.

With health care spending, an area where conventional wisdom holds that the poor are falling behind, the top group spends about 1.5 times the lowest group. For clothing, the top group spends just over twice the amount as the bottom group.

The top group spends almost three times as much on entertainment as does the lowest group, and just over twice as much as middle-income groups. And the top group spends three times as much on transportation as the lowest group, but only 1.6 times as much as the middle groups.

Spending on personal insurance and pensions shows the most inequality. Spending by the top group is more than 15 times the lowest group, and three times as much as the middle groups. This type of spending includes individual retirement accounts, 401(k) plans, and life insurance. It's not that the top group is spending substantially more, but it is saving more.
via NY Sun via Greg Mankiw Blog

Data from the BLS: 2005, 1985

Read More...

Thursday, November 30, 2006

Pitty the Dear Leader's Secret Santa

The Bush administration wants North Korea's attention, so like a scolding parent it's trying to make it tougher for that country's eccentric leader to buy iPods, plasma televisions and Segway electric scooters.

The U.S. government's first-ever effort to use trade sanctions to personally aggravate a foreign president expressly targets items believed to be favored by Kim Jong Il or presented by him as gifts to the roughly 600 loyalist families who run the communist government.

But the list of proposed luxury sanctions, obtained by The Associated Press, aims to make Kim's swanky life harder: No more cognac, Rolex watches, cigarettes, artwork, expensive cars, Harley Davidson motorcycles or even personal watercraft, such as Jet Skis.
This is my favorite trade sanction of all time. No iPods for you!

via USA Today

Read More...

3 Types of Blogs

Until recently, there were two main kinds of blogs. Most of the 57m blogs in existence are personal diaries that happen to be online. These blogs have tiny audiences and make no effort to sell advertising. Services such as Google's AdSense, which places text advertisements on blogs and generates a few cents per mouse click, might bring in some spare change. But according to Pew, an American research organisation, only 7% of bloggers say their main motivation is to make money.

The second main kind of blogs are, in effect, niche magazines that choose to publish in a blog format. These blogs are explicitly run as businesses, with paid staff doing the writing and sales departments selling advertising. The best example is Gawker Media, a stable of blogs that includes Gawker, a New York gossip site, and Gizmodo, a blog devoted to gadgets. Collectively its 14 blogs get 60m page views a month. Such blogs are “the most profitable media business today,” says Jason Calacanis, who runs Weblogs Inc, another stable of popular blogs that he sold to AOL, the web arm of Time Warner, a year ago. His sites, including Engadget, another gadget blog, are “an eight-figure-a-year business” with negligible distribution costs compared with the huge printing and shipping bills of traditional magazines.

Now, however, a third category is emerging: the mom-and-pop blog. “In the old days, we used to be called newsletter publishers,” says Om Malik, a technology writer who quit his job at Business 2.0 magazine in June to work full-time on his blog, GigaOm. He has hired two other writers, and his blog now attracts about 50,000 readers a day, generating “tens of thousands” in monthly revenues. Costs, including salaries, are around $20,000 a month.
I like this way of breaking into 3 categories. Very similar to the Long Tail of Book Publishing. I wonder how many 'niche magazines' and 'mom-and-pop' blogs there will be.

via The Economist

Read More...

Interesting Stats on America

A few interesting stats on America that I have come across in the last few days.

7 million people or 1 in every 32 adults, were in the nation's prisons and jails or on probation or parole at the end of last year. 2.2 million inmates were held in state and federal prisons or county and municipal jails. 93% of all inmates were male.

Every three months, 7 million to 8 million U.S. jobs disappear and roughly an equal or greater number are created.

Nationally, 47 million people speak a foreign language and 21 million speak English less than "very well."

In 1951, the average American ate 50 percent more than the average European. Americans, controlled two-thirds of the world's productive capacity, owned 80 percent of the world's electrical goods, and produced more than 40 percent of its electricity, 60 percent of its oil and 66 percent of its steel. America's 5 percent of the world's population had more wealth than the other 95 percent, and Americans made almost all of what they consumed: 99.93 percent of new cars sold in this country in 1954 were U.S. brands.

Read More...

Tuesday, November 28, 2006

US Food System Flow


Interesting look at the flow of food through the US food system (click on the image for a bigger version).

via Center for Sustainable Systems

Read More...

Monday, November 27, 2006

National Wildlife Photo Contest


Some very cool pixs (and if the caption for the photo is correct, those frogs are awful kinky).

Read More...

Sunday, November 26, 2006

Food CO2 and Land Footprints

I have written previously about my hope for acre and gallons labeling for food to tell how much energy and land it requires to produce various foodstuff. I ran something similar at the LCA Food Database. It collects data using a Life Cycle Assessment method to determine the amount of resources and wastes from soil to kitchen created by different food items. The numbers were collected off of Danish farms, but I would guess the ones in the US would be similar.

The following table shows the amount of CO2 emissions and square meters of land (for one year) used to create 1kg of the food item. I also added the amount of calories per kg of the food and then sorted based on square meters used per calorie.

item (1kg) g CO2 m^2 year calories m^2/ 1,000 cal co2/ calcal/ m2
beef steak 42,400 56.0 1980 28.3 21.435
frozen chicken 3,650 5.0 1840 2.7 2.0368
fresh chicken 3,160 5.0 1840 2.7 1.7368
oats, organic 594 3.3 3890 0.8 0.21,179
soy beans 620 3.3 4160 0.8 0.11,261
wheat, organic 376 2.5 3420 0.7 0.11,368
oat flakes 790 2.5 3820 0.7 0.21,528
oats, conventional 580 2.3 3890 0.6 0.11,691
soy/rapeseed oil 3,630 4.5 8840 0.5 0.41,964
wheat, conventional 727 1.5 3420 0.4 0.22,280
wheat flour 1,130 1.4 3390 0.4 0.32,421
frozen wheat bread 1,200 1.0 2600 0.4 0.52,600
wheat bread 840 1.0 2600 0.4 0.32,600
potatoes 184 0.3 930 0.3 0.23,000
potatoes, retail 161 0.3 930 0.3 0.23,000
sugar 960 0.5 4000 0.1 0.28,889
sugar beet 160 0.2


rape seeds, organic 1,320 5.7


rape seeds, conventional 1,550 3.5


A couple of observations. First, from a land usage/calorie created standpoint, meat comes out as the most intensive and potatoes and sugar comes out as the least. Beef is way higher than everybody else, more than 10 times higher than chicken and 280 times higher than sugar. Substituting chicken for beef decreases your land usage by 90%. While I don't think sugar is particularly healthy, from a resource standpoint, it is very efficient needing much less space per calorie than any grains.

Second, the more processed, the more CO2 is emitted. Eating raw food, therefore emits less CO2 per calorie eaten. You might also think that this would mean it is better to buy raw ingredients and cook at home. Actually though, as this report shows (p9), baking bread in an industrial setting is more energy efficient than everybody baking at home. So unless you are going to eat the food raw, from an energy standpoint better to have it processed for you.

item (1kg) g CO2 m2 year extra energy extra land
rape seeds, organic 1,320 5.7
63%
rape seeds, conventional 1,550 3.5 17%
wheat, organic 376 2.5
67%
wheat, conventional 727 1.5 93%
oats, organic 594 3.3
43%
oats, conventional 580 2.3 -2%


Comparing organic with conventional farming, there is a trade off between using more land and using more energy (currently in the form of fossil fuels). Organic oats required 43% more land, rape seeds 62% more and wheat 66% more. On the CO2 side, conventional farming emits 17% more for rape seeds, 93% more for wheat and 2% less (huh?) for oats. I am not sure how to access which is more valuable: extra land for nature or less carbon emissions. But, the idea that organic is better for the environment in all ways does not appear to be true. Hopefully in the future we will have sustainable artificial fertilizer made from renewable energy, so we won't have to make this choice.

Read More...

Wednesday, November 22, 2006

Humans Have Multiple Copies of Some Key Genes

Scientists have discovered a dramatic variation in the genetic make-up of humans that could lead to a fundamental reappraisal of what causes incurable diseases and could provide a greater understanding of mankind.

The studies published today have found that instead of having just two copies of each gene - one from each parent - people can carry many copies, but just how many can vary between one person and the next.

One of the real surprises of these results was just how much of our DNA varies in copy number. We estimate this to be at least 12 per cent of the genome - that has never been shown before. They found that 2,900 genes could vary in the number of copies possessed by the individuals.

The findings mean that instead of humanity being 99.9 per cent identical, as previously believed, we are at least 10 times more different between one another than once thought.

Another implication of the finding is that we are more different to our closest living relative, the chimpanzee, than previously assumed from earlier studies. Instead of being 99 per cent similar, we are more likely to be about 96 per cent similar.
via The Independent

Read More...

Interesting Articles of the Week

Wild Sex: Where Monogamy is Rare.

Banking on Indian umbilical cords.

How to sharpen your senses.

Microsoft could save 45 million tons of CO2 emissions with a few lines of computer code.

A Dutch town installs street mikes that use acoustic-recognition tech to listen for signs of aggression then alert authorities if things get out of hand.

Read More...

Environmental Shopping Plugin

Based on this post from TechCrunch, I installed this Mpire price comparison browser plugin tool. It is pretty cool.

Basically when you shop at Amazon, Wal-Mart or some other popular online stores, you see what the price of that product is at other online stores and online auctions in a little pop-up (pop-in?) window at the bottom of the screen (click on the picture to the left to see what I am talking about).

Now comparing prices is useful, but what if instead of showing comparison prices, the pop-up window had additional environmental information? What if it told you the pounds of carbon dioxide, whether it was FSC certified, or how much energy it took to make the product? That would be really cool.

I wrote about GreenOffice which allows you to compare office supplies based on their greenness rather than just their price. What if you could make decisions based on this kind of information no matter where you shopped online?

I figure I could create such a browser plugin, but what I don't have is a database of environmental information that is linked to products. If anyone knows where I could find such a database, possibly with data such as carbon dioxide emissions, energy use, chemical use, or land footprint, please leave a comment.

Read More...

Tuesday, November 21, 2006

74% of Americans Support A Federal Gasoline Tax

According to a survey of 1,016 adults in the United States conducted by the Opinion Research Corporation:

74% support federal gasoline taxes devoted to renewable energy R&D.
I have called for such a tax to support R&D. With support like that I don't know why politicians aren't willing to bring it up.

via Green Car Congress

Read More...

Monday, November 20, 2006

Compass in Your Nose

Some years ago scientists at CALTECH (California Institute of Technology in Pasadena) discovered that humans possess a tiny, shiny crystal of magnetite in the ethmoid bone, located between your eyes, just behind the nose.

Magnetite is a magnetic mineral also possessed by homing pigeons, migratory salmon, dolphins, honeybees, and bats. Indeed, some bacteria even contain strands of magnetite that function, according to Dr Charles Walcott of the Cornell Laboratory of Ornithology in Ithaca, New York, "as tiny compass needles, allowing them [the bacteria] to orient themselves in the earth's magnetic field and swim down to their happy home in the mud".

It seems that magnetite helps direction finding in animals and helps migratory species migrate successfully by allowing them to draw upon the earth's magnetic fields. But scientists are not sure how they do this.

In any case, when it comes to humans, according to some experts, magnetite makes the ethmoid bone sensitive to the earth's magnetic field and helps your sense of direction.
I had read previously that this was how birds are able to fly south for the winter, but I had no idea that humans had them as well.

via The Register

Read More...

AIDS is Wrong Disease to Attack in Africa

For a given unprotected sexual relationship with an HIV-infected person, Africans are between four and five times more likely than Americans to become infected with HIV themselves. This stark fact accounts for virtually all of the difference in population-wide HIV rates in the two regions.

There is more than one reason why HIV spreads more easily in Africa than America, but the most important one seems to be related to the prevalence of other sexually transmitted infections. Estimates suggest that around 11 percent of individuals in Africa have untreated bacterial sexually transmitted infections at any given time and close to half have the herpes virus. Because many of these infections cause open sores on the genitals, transmission of the HIV virus is much more efficient.

So what do we learn from this? First, the fact that Africa is so heavily affected by HIV has very little to do with differences in sexual behavior and very much to do with differences in circumstances. Second, and perhaps more important, there is potential for significant reductions in HIV transmission in Africa through the treatment of other sexually transmitted diseases.

Such an approach would cost around $3.50 per year per life saved. Treating AIDS itself costs around $300 per year. There are reasons to provide AIDS treatment in Africa, but cost-effectiveness is not one of them.
via Esquire

Read More...

Friday, November 17, 2006

European Poverty

Interesting look at poverty in Europe.

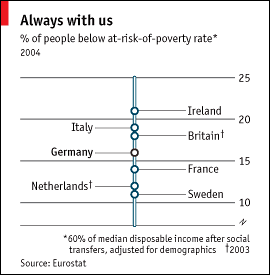
As in many rich countries, poverty is growing. In 2004 some 16% of Germans were poor, defined as having disposable income less then 60% of the national median after social transfers—a sharp rise from 2000. This is around the European average (see chart), but German poverty was once well below that average. Admittedly the figure is inflated by the effect of unification. Poverty in the east is at a British-style 20%—a level also reached among the young and immigrants.
Poverty is rising in Europe just like in the US. This makes me think that rising poverty in the US is more likely being caused by globlization (although it is also causing poverty and income inequality world wide to decrease) and a transition from an industrial to a knowledge economy than social or tax policy in the US.

I have written before about how the American definition of poverty is a bit suspect as it doesn't take the Earned Income Tax Credit into account. I don't know what to think of the European one: 60% of the national median after social transfers. I go back and forth on whether the definition of poverty should be relative to the wages of others or if it should be an absolute based on the ability to pay for food, shelter, clothing and medicine. Maybe they end up with similar results.

I wonder where America would show up on the chart with this definition. My guess is somewhere next to Britain, but I really don't know.

via The Economist

Read More...

Reforestation and GDP


Researchers led by Pekka Kauppi of the University of Helsinki in Finland sought to identify exactly how much carbon is stored in the world's forests. They analysed reports on the state of forests in 50 countries in 1990 and 2005 compiled by the United Nations Food and Agriculture Organisation. They also used information contained in national databases dating back hundreds of years.

The researchers calculated that the “forest identity” had increased over the past 15 years in 22 of the world's 50 most forested countries. Forests are also gaining ground in the world's two most populous countries, India and China. Other Asian countries that have gone from deforestation to afforestation include South Korea and Vietnam.

Globally, the total number of trees and associated organic matter has fallen year on year, in some places for as long as records have existed. Poor management in Brazil and Indonesia has been a particular problem: both countries lost greater volumes of timber than America and China even though America and China harvested more wood.
Sounds consistent with what I blogged about earlier. Forests in temperate countries are increasing but tropical ones are decreasing but at a faster rate. The key to stopping the decline lies in Brazil and Indonesia.

What I found new and interesting was this part.
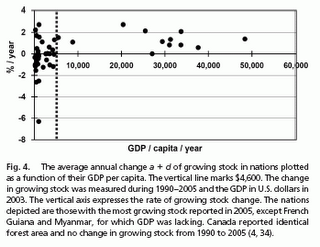
The results, published in the Proceedings of the National Academy of Sciences, show that in all the countries that have a GDP per head of $4,600 or more—making them richer than, say, Chile—forests are recovering.

The researchers argue that the trend is partly the result of social changes that occur as countries develop and become wealthier, such as the movement of rural dwellers to cities. Urbanisation decreases the likelihood of trees being felled for heating and building.
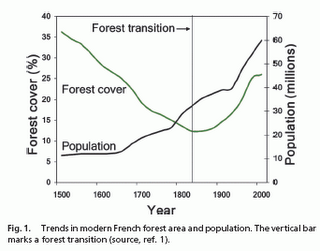
Higher GDP leads to reforestation. This would make one think that GDP growth is good for forests. I think it is a little more complicated as this graph of France shows. It displays a classic environmental Kuznets curve where GDP growth starts by decreasing the number of forests and then reverses at higher incomes and forests increase again. But, as this graph shows the recovery has yet to reach the pre-industrialization level.

via The Economist and Nobel Intent

Read More...

New DNA Test Is Yielding Clues to Neanderthals

Scientists are sequencing the DNA of a Neanderthal with a new DNA sequencing machine.

But recently a new kind of DNA sequencing machine was invented. Made by 454 Life Sciences of Branford, Conn., it prompts each DNA unit to generate a flash of light by stimulating the firefly enzyme luciferase. The flashes are captured by the same sort of image-sensing plate used in telescopes to capture starlight. From the timing and position of the flashes, a computer reconstructs the sequence of the DNA units. The kind of DNA the 454 machine works best with are tiny fragments the size of those found in old bones.
Luciferase? Are they just trying to shove this one in the face of Creationists?

So, how similar are we?
From the data so far, Dr. Rubin’s team reports that the Neanderthal and human genomes are at least 99.5 percent identical. Dr. Paabo’s team has calculated that the “effective” size of the founding Neanderthal population was about 3,000, corresponding to a census size of fewer than 10,000 individuals.

The genetic differences between humans and Neandertals is "a drop in the bucket" compared to the estimated 30 million to 50 million base pair differences between humans and chimpanzees, he said.
That sounds pretty close.

I don't get how they can determine the population size from the DNA of just one individual. I should look into that.

Could they talk?
If the full Neanderthal genome is retrieved, biologists may be able to ask if the Neanderthals had language by looking at their version of the human gene known as FOXP2, thought to be one of the last components to evolve in mediating the modern human language faculty. FOXP2 has changed significantly since the human lineage split apart from that of chimps some six million years ago. If the Neanderthal version resembles the chimp version, that would make it less likely they had modern, syntactical language.
That is pretty cool, but we are just beating around the bush. Let's clone this sucker.

via NY Times and National Geographic

Read More...

Thursday, November 16, 2006

Cost of Crime

I have been curious what the cost of crime is in the US and I came across a couple of estimates:

Duke University and CFO Magazine recently surveyed corporate chief financial officers, who reported spending 2.8 percent of total revenue on terrorism-related measures, up from 1.7 percent before 9/11 (with a median firm size of $2.1 billion in annual sales, that would translate to $59 million a year). The Centers for Disease Control and Prevention magazine calculated the health-related costs of rape, physical assault, stalking and homicide by intimate partners at $8.8 billion a year. The National Crime Prevention Council estimated the cost of crime at $428 billion a year.

David Anderson, associate professor of economics at Centre College in Danville, Ky., in a 1999 study came up with a figure of $1.7 trillion a year, a figure which includes everything from locks and security systems to decreased property values that occur in high-crime areas and the cost of lost productivity from people engaged in criminal activity or jailed instead of doing useful work.
Hopefully I will have time later to look into these numbers and see how they were calculated.

via Seattle PI

Read More...

How Does Your Nest Egg Rate?

In case you were wondering how your savings compared with other Americans, here you go.

 “Nest egg savings” of American households, 2001
AgeMedianTop 25%Top 10%Top 5%Top 1%
20 to 29 yrs5,55021,70061,690100,600833,530
30 to 3922,25097,400242,977440,8001,517,400
40 to 4952,300222,000532,600971,9003,677,004
50 to 5995,130339,000948,0001,933,0008,420,400
60 to 6983,400310,9001,099,3402,401,5509,459,800
70 to 7962,500296,300877,3001,561,6006,038,000
80 and over51,350223,800561,200911,6002,037,300

Source: Federal Reserve Survey of Consumer Finances, VIP Forum (The age range given typically reflects the maturity of the oldest person in the house. "Nest egg savings" refers to net worth, excluding home equity.)

 Home equity as a percentage of net worth, 2001
AgeMediantop 25%top 10%top 5%top 1%
20 to 29 yrs29.2%42.6%34.7%38.3%5.9%
30 to 3942.3%34.2%31.0%17.3%17.2%
40 to 4951.1%31.6%21.4%19.4%11.6%
50 to 5946.8%25.7%17.9%20.6%7.0%
60 to 6950.4%32.9%22.0%16.1%2.7%
70 to 7964.0%39.1%18.6%16.3%14.2%
80 and over64.1%35.3%29.2%21.8%12.3%
Source: Federal Reserve Survey of Consumer Finances, VIP Forum

via MoneyCentral

Read More...

Wednesday, November 15, 2006

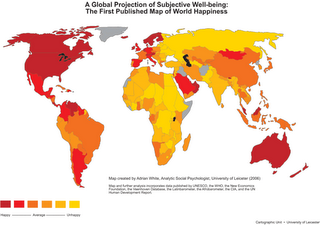
Psychologist Produces The First-ever 'World Map Of Happiness'

Adrian White, an analytic social psychologist at the University's School of Psychology, analysed data published by UNESCO, the CIA, the New Economics Foundation, the WHO, the Veenhoven Database, the Latinbarometer, the Afrobarometer, and the UNHDR, to create a global projection of subjective well-being: the first world map of happiness.

Participants in the various studies were asked questions related to happiness and satisfaction with life. The meta-analysis is based on the findings of over 100 different studies around the world, which questioned 80,000 people worldwide. For this study data has also been analysed in relation to health, wealth and access to education.

Whilst collecting data on subjective well-being is not an exact science, the measures used are very reliable in predicting health and welfare outcomes.

There is increasing political interest in using measures of happiness as a national indicator in conjunction with measures of wealth. A recent BBC survey found that 81% of the population think the Government should focus on making us happier rather than wealthier.

Further analysis showed that a nation's level of happiness was most closely associated with health levels (correlation of .62), followed by wealth (.52), and then provision of education (.51).

The three predictor variables of health, wealth and education were also very closely associated with each other, illustrating the interdependence of these factors.

There is a belief that capitalism leads to unhappy people. However, when people are asked if they are happy with their lives, people in countries with good healthcare, a higher GDP per captia, and access to education were much more likely to report being happy.
And if you were wondering how countries rate in happiness, here are some rankings: 1. Denmark, 2. Switzerland, 8. Bhutan, 10. Canada, 23. USA, 62. France, 82. China, 90. Japan, 125. India, 167. Russia.

via ScienceDaily

Read More...

Interesting Articles of the Week

'Air shower' set to cut water use by 30 percent.

Contact lenses check blood sugar.

Physics promises wireless power.

Grid computing will let town planners play 'SimCity' for real.

Read More...

Tuesday, November 14, 2006

How To Save 1 Billion Gallons of Fuel Annually

The widespread application of new aerodynamic technologies on tractor-trailer trucks could cut US fuel consumption by nearly one billion gallons per year, according to the results of a two-year collaborative study conducted by members of the Truck Manufacturers Association (TMA) and the US Department of Energy (DOE).

Technologies that improve truck aerodynamics in several key areas include:
  • Gap Enclosure: reduces aerodynamic drag in the gap between the tractor and trailer.
  • Side Skirts: improves aerodynamics and reduces airflow under the trailer in crosswinds.
  • Boat Tails: tapers back of trailer to minimalize wake airflow.
  • Side Mirror Design: reconfigures shape and support systems to reduce aerodynamic drag.
The calculation of one billion gallons is based on the Census Bureau’s 2002 Vehicle Inventory and Use Survey (VIUS). It assumes 750,000 tractor/van semi-trailer combination-unit trucks in operation traveling a total of 60,101 million miles. A 10% improvement in average fuel economy from 5.5 mpg to 6.05 mpg results in saving approximately 993.4 million gallons of fuel per year.
That is an impressive savings. At $2 a gallon, that is a savings of $2 billion. I would think that there would be a financial incentive to make this happen.

At 60.1 billion miles and 5.5 mpg that is 10.9 billion gallons of fuel a year. With 300 million Americans that works out to 36 gallons of fuel per person to transport all of our goods each year.

As large as 1 billion gallons sounds, keep in mind that the US uses around 150 billion gallons of gasoline a year, so this would be less than a 1% savings. But, save a billion gallons here, a billion gallons there, and all of a sudden you are talking real savings.

via Green Car Congress

Read More...

Sequence Your Genome For $100,000

Solexa, based in Hayward, Calif., is one of several companies trying to develop methods to determine the sequence of DNA in an organism at less cost and far more quickly than the technology used only a few years ago in the Human Genome Project.

Eventually DNA sequencing might be so cheap that every person would be able to carry around his or her complete genetic blueprint on a DVD or computer chip.

That day is still far in the future. But Solexa is expected to soon begin shipping a DNA sequencing machine that it claims will be able to determine the three billion DNA units in a person’s genome for about $100,000, about one-hundredth the cost of using older sequencers.
That is amazing that the price is already down to $100,000. I wonder what the Moore's law of DNA sequencing looks like.

The thing I have never understood is that the human genome is just one copy of 23 chromosomes while each person has 2 copies. When you are getting your own genome sequenced, I would assume you would do it for both copies. I believe that would be 6 billion DNA units. So, wouldn't having your "genome" sequenced really cost twice as much or $200,000? If anyone knows the answer, please leave a comment.

via New York Times

Read More...

Artificial Chromosomes

Today, obstacles to germ line engineering are practical, not theoretical. Scientists have the ability to add desired genes - snapping gene cassettes onto artificial chromosomes and injecting the chromosomes into newly fertilised eggs. Because every cell in the body is a descendant of that first fertilised egg, every cell would have a copy of the artificial chromosome once inserted.

Artificial chromosomes, even human artificial chromosomes, have already been created and patented, the scientists reported, and companies have sprung up to exploit the technology. Dr. Leroy Hood, chairman of the department of molecular biotechnology at the University of Washington in Seattle, said he has now developed a way to create an entire custom chromosome on a computer chip containing DNA.

Scientists at the meeting spoke quite seriously about extending the human life span with cassettes of anti-ageing genes. They also envisioned adding cassettes of anti-cancer genes and genes that would confer resistance to the AIDS virus.

Previously, researchers at Chromos Molecular Systems of Burnaby in British Columbia, Canada, used artificial chromosomes to add an extra gene to cells grown in the lab, and showed that the gene functioned when the cells were transplanted into mice. Now, Oshimura has actually corrected a genetic defect in stem cells.

Oshimura's team worked with stem cells from the testes of new-born mice in which the so-called P53 gene had been knocked out - P53 makes a protein that prevents tumour growth. Adding an artificial chromosome carrying a copy of P53 restored production of the protein in the stem cells, and activated another gene that is normally controlled by P53.

At the same meeting, Chromos announced that its researchers have inserted artificial chromosomes into human embryonic stem cells. Company vice-president Harry Lebedur claims that Chromos's chromosomes have the advantage that they can be more easily purified from the cell cultures in which they are grown and can be transferred to stem cells with greater efficiency.
That is pretty cool that they can create artificial chromosomes and insert them into germ cells. I wonder what happens to the children of someone who has an extra chromosome?

via The Guardian

Read More...

Saturday, November 11, 2006

Humans in Charge of 98% of Terrestrial Vertebrates

Amazing statistic courtesy of Daniel C. Dennett in his book Breaking the spell: religion as a natural phenomenon (as found at 3 Quarks Daily).

Since both the domesticated animals and their domesticators have enjoyed huge population explosions (going from less than 1 percent of the terrestrial vertebrate biomass ten thousand years ago to over 98 percent today--see Appendix B) there can be no doubt that this symbiosis was mutualistic--fitness-enhancing to both parties.
This is amazing. I had commented before on The Living Planet Index that it should also include humans and our livestock. I had no idea that this would account for 98% of terrestrial vertebrates.

I came across this in his TED Talk (if you haven't checked out the TED talks you should, some really interesting speakers there). He attributes this calculation to Paul MacCready. I tried to figure out exactly how Paul calculated this and was unable. But I did find out that the original figure was .1% (rather than 1%) and that this includes all land and air vertebrates (excludes marine vertebrates).

According to Eco-Economy there are 1.5 billion cattle and buffalo and 1.8 billion sheep and goats that humans have domesticated. Add in 6 billion humans and that is a lot of biomass.

Read More...

Friday, November 10, 2006

Pew Research on Happiness

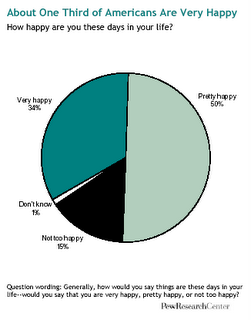
What makes people happier? Pew Research interviewed 3,000 people and analyzed the data.

Married people are happier than unmarrieds. People who worship frequently are happier than those who don't. Republicans are happier than Democrats. Rich people are happier than poor people. Whites and Hispanics are happier than blacks. Sunbelt residents are happier than those who live in the rest of the country.

We also found some interesting non-correlations. People who have children are no happier than those who don't, after controlling for marital status. Retirees are no happier than workers. Pet owners are no happier than those without pets.

One way to find out is by way of a statistical technique known as multiple regression analysis, which gauges the relationship between each factor and happiness while controlling for all the other factors. That analysis shows that the most robust correlations of all those described in this report are health, income, church attendance, being married and, yes, being a Republican.

The same regression analysis also finds that education, gender, and race do not have a statistically significant independent effect on predicting happiness, once all the other factors are controlled.
via Pew Research via Audaucious Epigone

Read More...