A New Hope
 More spoofs of the Obama poster here.
I was under the impression that, on average, men have been more educated then women up until very recently. But, according to this graph from The Race between Education and Technology, men only held the lead briefly from 1930-1950.
College graduation rates on the other hand show a different story, more in line with what I expected. Men held the lead until 1960, but have now fallen 5% behind women.
Aside: As I was reading this book, I realized that I enjoy reading charts and graphs much more than reading words. I wish there were more books that were made up of nothing but charts and graphs like Understanding USA. Unfortunately, the chart and graph genre is sorely underrepresented at the book store.


The price of gene sequencing is falling fast and Helicos BioSciences is poised to push it down even further — perhaps below the $1,000 mark.via Wired
This video offers a beautiful look at their technology.
A single molecule in the intestinal wall, activated by the waste products from gut bacteria, plays a large role in controlling whether the host animals are lean or fatty, a research team, including scientists from UT Southwestern Medical Center, has found in a mouse studyCan't wait for the day when I can tweak the types of bacteria that are living in my gut for optimum health.
Using mice, the researchers focused on two species of bacteria that break up dietary fibers from food into small molecules called short-chain fatty acids. Dr. Yanagisawa's team previously had found that short-chain fatty acids bind to and activate a receptor molecule in the gut wall called Gpr41, although little was known about the physiological outcome of Gpr41 activation.
The researchers disrupted communication between the bacteria and the hosts in two ways: raising normal mice under germ-free conditions so they lacked the bacteria, and genetically engineering other mice to lack Gpr41 so they were unable to respond to the bacteria.
In both cases, the mice weighed less and had a leaner build than their normal counterparts even though they all ate the same amount.
The researchers also found that in mice without Gpr41, the intestines passed food more quickly. They hypothesized that one action of Gpr41 is to slow down the motion that propels food forward, so that more nutrients can be absorbed. Thus, if the receptor cannot be activated, food is expelled more quickly, and the animal gets less energy from it.

Hypnosis lets regular people see numbers as colors.
Hot drinks equal warm feelings, as scientists link physical and emotional warmth.
Google settles book-scan lawsuit, everybody wins.
Climate change, acid rain could be good for forests.
Copper door handles and taps kill 95% of superbugs in hospitals.
Among the other issues it highlights is a strong link between mental illness and debt. Half of people in Britain who are in debt have a mental disorder, compared with just 16 per cent of the general population.Interesting. I wonder which way the causation goes.
Rachel Jenkins, of the Institute of Psychiatry in London, who led this section of the report, said: “We’ve known for a while there’s a link between mental health issues and low income, but what more recent research has shown is that that relationship is probably mostly accounted for by debt.”
 I am fan of the new version of Yahoo Mail, especially with my Narrowscreen setup. But, there is one part that annoys me. When you start Yahoo Mail up, instead of being taken to your inbox, they take you to the "home" page that displays weather and news.
There is no way to go directly to your inbox. Or I should say there is no way to do so with the free version. If you upgrade to the paid version then you can do this. I guess they are trying to annoy you enough that you pay to upgrade. That or else they want a chance to display more ads for freeloaders like myself (well not like myself as I have Adblock and this Yahoo Mail Ad and Sidepan Removal Greasemonky script installed to block all of Yahoo's ads).
The thing is, I would not mind this home page if it were customizable. If they took the features of My Yahoo and integrated into the Yahoo Mail home page, I would be happy with it. Then I would be able to check sport scores, stock prices, weather, and news all while staying in Yahoo Mail.
With all the trouble going on in Yahoo land they are probably not able to make big changes, but integrating My Yahoo into Yahoo Mail would be really useful for users like myself.
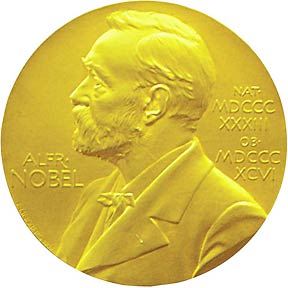 Paul Krugman was recently awarded the Nobel Prize in Economics. Reading about the work that lead to his prize, I couldn't help but notice how it was relevant to my recent Economic vs. Ecological Statistics post.
From the press release:
In addition to economies of scale in production, Krugman’s new theory was based on an assumption that consumers appreciate diversity in their consumption. At the time, this was a rather new concept in economics, but it appeared to correspond to reality.Apparently way back in 1979 Krugman proposed the idea that there was value in increased diversity of products to choose from. I wish I could read the original article to see exactly what he stated, but $31.50 for a 10 page article is a bit steep for me (please hurry open-source science movement). Krugman's work explained why most trade was between rich countries rather than rich and poor countries as Ricardo's comparative advantage model predicted. But, instead of basing his new theory of trade model on the value of product diversity, he went with a model of monopolistic behavior. I think this misses lots of the reason for trade between countries of similar resources. Americans aren't buying French wine because trade allows for greater economies of scale for wineries, but rather because they value having different types of wine to choose from.
Consider the simplest model (based on Krugman 1979). In this model there are two countries. In each country, consumers have a preference for variety but there is a tradeoff between variety and cost, consumers want variety but since there are economies of scale - a firm's unit costs fall as it produces more - more variety means higher prices. Preferences for variety push in the direction of more variety, economies of scale push in the direction of less. So suppose that without trade country 1 produces varieties A,B,C and country two produces varieties X,Y,Z. In every other respect the countries are identical so there are no traditional comparative advantage reasons for trade.This model predicts that with trade global diversity decreases while local diversity increases. Here they argue this is a good thing as consumers all have more products to choose from. Now take this logic and apply to ecology. In Hawaii, it is estimated that there have been 1,000 new invasive plant species introduced while 97 local plant species have gone extinct. The local biodiversity in Hawaii has increased, but global biodiversity has decreased. Ecologists focus on species going extinct and see this as a bad thing, but local Hawaiians have greater diversity of plants on their land then they have ever had before.
Nevertheless, if trade is possible it is welfare enhancing. With trade the scale of production can increase which produces costs and prices. Notice, however, that something interesting happens. The number of world varieties will decrease even as the number of varieties available to each consumer increases. That is, with trade production will concentrate in say A,B,X,Y so each consumer has increased choice even as world variety declines.
Increasing variety for individuals even as world variety declines is a fundamental fact of globalization. In the context of culture, Tyler explains this very well in his book, Creative Destruction; when people in Beijing can eat at McDonald's and people in American can eat at great Chinese restaurants the world looks increasingly similar even as each world resident experiences an increase in variety.

The Model S, an all-new 4-door 5-passenger zero-emissions luxury sedan powered by a lithium-ion battery pack. Tesla says the Model S will get about 240 miles per charge while still offering "exceptional performance." Numbers being bandied about include 0–60 mph in less than 6 seconds. The Model S will have a base price of about $60,000 (versus the Roadster's $109,000 price tag) when it goes on sale in late 2010.That looks really good. The 240 mile range is also better than the 225 range they announced previously.
Amazon Kindle is either Oprah’s favorite gadget or Amazon sent over the largest fruit basket looking for the ultimate endorsement. Either way, by using OPRAHWINFREY as a coupon code, her glorious name nets you $50 off the e-books standard $359 price. Gosh, is there anything Oprah can’t do?Act quickly. Offer only good until November 1st, 2008.
While Google has their 10100 project, I use a similarly geeky shorthand to refer to a topic I think about often: the 1010 in 211 problem. Translated: what needs to be done to maximize the well-being of 10 billion people in the year 2048?
Why 1010?
In 2048, there are likely to be close to 10 billion people living on the Earth, as the best estimates for the world population in 2050 are around 9-9.4 billion people.
10 billion people is also a good goal for stabilizing the world population at. This would not be easy and require a large effort to increase female education and improve access to family planning.
Why 211?
2048 is 40 years from now. 40 year is half an average lifetime and the approximate length of a working career. It is long enough for serious changes to occur, but also short enough that you can predict much of what will happen.
2048 is also within rounding distance of 2050, the halfway marker of the century.
Questions raised by the 1010 in 211 problem
The 1010 in 211 problem is at the root of many of the posts here at Fat Knowledge. I flushed out a lot of my thoughts on this topic in my Buddhist Economics post. Many of the new technologies I highlight, the economic statistics that I look at, and the environmental ideas I write about are at their root partial answers to the 1010 in 211 problem. But, I still have a lot of questions that I am searching for answers to. Here is a list of some of them:
If you want to volunteer 5 hours a week to work on this problem, how can you best spend your time?
If a philanthropist had $10 million dollars to dedicate to this problem, how should that money be spent?
If an idealist is just graduating from college, how should they spend their time and energy to best tackle this problem?
What are the best metrics for measuring human well-being?
Is humanity doing a good job of allocating resources to maximize the well-being of those in 2048?
Is capital being allocated in a way that will maximize well-being and if not, how can the incentives be changed to make it so?
How are we going to produce enough food to feed 10 billion people and how much land will it require?
How are we going to provide enough energy in a sustainable way for all these people?
How are we going to reach the previous two goals and still protect the environment and leave enough land and resources for wildlife?
What would it take to spread a US level of affluence to 10 billion people?
Are the best and brightest going into the right fields to maximize their impact on the well being of humanity?
Are there too many or too few scientists, doctors, teachers, lawyers, business men, pastors, financiers, academic researchers, farmers, and athletes?
How can we minimize the amount of natural resources that are required to live a good life?
What ideas don't have enough good minds thinking about them?
How can we stabilize population so every child has enough resources allocated to them to reach their full potential?
Is enough basic research being conducted? Would the world be better off with more scientists?
Which technologies are likely to provide the greatest improvement in well-being and is there enough research being done on them?
What is the best way to eradicate poverty?
What needs to be done to make every human literate?
How do we eliminate preventable diseases?
David Pogue interviews E.O. Wilson about the Encyclopedia of Life project, and asks him how many species are known and unknown:
And in that period of time, we have found and given names to perhaps one-tenth of what's on the surface of the earth. We have now found 1.8 million species. But the actual number is almost certainly in excess of 10 million, and could be as high as a hundred million, when you throw in bacteria.Looks like we have found around 10% of all species. Although, how exactly can you know until we find them all? Geneticists believed humans had around 100,000 genes until they sequenced the genome and found out we only have 20-25,000.
Listen: What would thrill people the most about space exploration? Surely it would be the discovery of life on another planet.I would love for a President Obama to make finding all species on Earth his "mission to the moon" and set a goal to accomplish this in 10 years. Similar to the quest to sequence the human genome, the US would take the lead position, but wouldn't do it alone. Instead we would encourage other countries to join with us and dedicate as many scientists as they can to the quest. I wonder how much money and how many scientists it would take to accomplish this in 10 years?
Then, Congress, if it weren't busted, would be willing to put out billions to explore that planet--find out all of the life forms there. Why shouldn't we be doing the same for planet earth? It's a little-known planet. Ninety percent of the life forms unknown to us.
And this is gonna be fun. This is a return to exploring a little-known planet.
China aims for universal health care.
Nature loss 'dwarfs bank crisis'.
Taking placebo seriously.
Rich cheat more on taxes, new study shows.
Zombie animals and the parasites that control them.

Any mention of redistribution of wealth in America would normally scupper a politician's ambitions, but Barack Obama has managed to preserve his lead in the polls while also saying that he wants to “spread the wealth around”. And there is a lot of spreading potential: income distribution in America is the widest of the 30 countries of the OECD.Two quick thoughts.
A “five-a-day” programme of social and personal activities can improve mental wellbeing, much as eating fruit and vegetables enhances physical health, according to Foresight, the government think-tank. Its Mental Capital and Wellbeing report, which was compiled by more than 400 scientists, proposes a campaign modelled on the nutrition initiative, to encourage behaviour that will make people feel better about themselves.via Times OnlineConnect
Developing relationships with family, friends, colleagues and neighbours will enrich your life and bring you supportBe active
Sports, hobbies such as gardening or dancing, or just a daily stroll will make you feel good and maintain mobility and fitnessBe curious
Noting the beauty of everyday moments as well as the unusual and reflecting on them helps you to appreciate what matters to youLearn
Fixing a bike, learning an instrument, cooking – the challenge and satisfaction brings fun and confidenceGive
Helping friends and strangers links your happiness to a wider community and is very rewarding

Estimated change (percentage) in natural NPP from croplands. Noteworthy are regions where mechanization, irrigation, and fertilization increase cropland productivity above natural rates, while crop NPP in other regions is less than the natural NPP. Calculated from recent analyses of crop yields (10) and ecosystem productivity (11).Looks like parts of Western Europe, the US, Canada, China, northern India and Malaysia(!?!) have increased Net Primary Productivity, while parts of Eastern Europe, India, Nigeria, and the US have decreased NPP. This helps to explain why Eastern Europe has so much more lost potential NPP (27%) than Western Europe (7%). The advanced farming techniques of Western Europe have helped them make up for other loses.
 Interesting. Basically 1/5 of tax filers didn't pay any income tax under Reagan, 1/4 didn't under Clinton, 1/3 didn't under Bush and based on current proposals, just under 1/2 won't under the next president. Makes me wonder if Joe the Plumber will be paying any income taxes at all.
More information here.
via Economix via Greg Mankiw
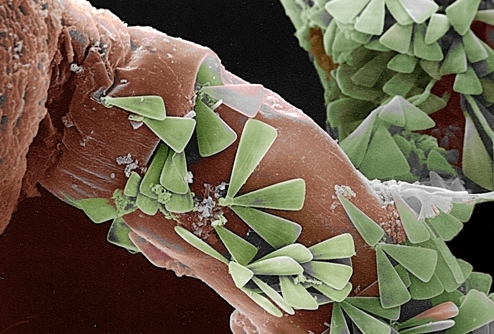
Tiny green diatoms create the illusion of a fernlike forest as they attach to their marine-invertebrate hosts.via National Geographic
Mario De Stefano of the Second University of Naples, Italy, captured this miniscule "jungle" from the Mediterranean Sea with a scanning electron microscope.
The image earned first place in the photography category of the 2008 International Science and Engineering Visualization Challenge.

BMW's finally pulled the wraps off the 204-horsepower all-electric Mini it is bringing to America and says the car could be here as early as next year, although just 500 people will be lucky enough to get their hands on one.Looks pretty good. The Mini has 35 kWh of batteries and has a range of 150 miles. For comparison, the Tesla Roadster has 50 kWh of batteries and a range of 200 miles. The 2.5 hour recharging time sounds good too.
BMW says it will lease the Mini E two-seater to "select private and corporate customers" in California, New York and New Jersey under what is essentially a big R&D project to develop EVs through its Project i.
BMW isn't saying what the leases will cost. Whatever it is, those who get their hands on one will be getting what is a sweet little car if only because it's an EV that doesn't look like a toy.
The Mini E features a 150-kilowatt (204 horsepower) asynchronous motor coupled to a single-stage helical gearbox. The drivetrain produces 162 foot-pounds of torque the moment you hit the accelerator, propelling the car from 0 to 62 mph in 8.5 seconds. Top speed is limited to 95 mph.
Power comes from a 35-kWh, lithium-ion battery with a range of 150 miles. It is comprised of 5,088 individual cells in an air-cooled battery pack that weighs 573 pounds and charges in about eight hours. Those who lease the car get a "wallbox" that BMW will install in customers' garages to increase the amperage, reducing the charge time to 2.5 hours. Regenerative braking will help keep the battery charged out on the road, an arrangement BMW says extended the battery's range by 20 percent.
On Monday, they may learn the answers to these and other questions — and, if all goes according to plan, so will everyone else who cares to visit a public Web site, www.personalgenomes.org. The three are among the first 10 volunteers in the Personal Genome Project, a study at Harvard University Medical School aimed at challenging the conventional wisdom that the secrets of our genes are best kept to ourselves.Ironic that this project about genetic transparency uses the acronym PGP, also used for Pretty Good Privacy, a way to encrypt computer files.
The goal of the project, which hopes to expand to 100,000 participants, is to speed medical research by dispensing with the elaborate precautions traditionally taken to protect the privacy of human subjects. The more genetic information can be made open and publicly available, nearly everyone agrees, the faster research will progress.
In exchange for the decoding of their DNA, participants agree to make it available to all — along with photographs, their disease histories, allergies, medications, ethnic backgrounds and a trove of other traits, called phenotypes, from food preferences to television viewing habits.
Including phenotypes, which most other public genetic databases have avoided in deference to privacy concerns, should allow researchers to more easily discover how genes and traits are linked. Because the “PGP 10,” as they call themselves, agreed to forfeit their privacy, any researcher will have a chance to mine the data, rather than just a small group with clearance.
According to a new report by the British Department for Environment, Food and Rural Affairs, reusable cloth diapers (apparently referred to as nappies on the other side of the pond) have a larger carbon footprint than their plastic disposable brethren.
The report found that while disposable nappies used over 2½ years would have a global warming impact of 550kg of CO2 reusable nappies produced 570kg of CO2 on average. But if parents used tumble dryers and washed the reusable nappies at 90C, the impact could spiral to 993kg of CO2.via Times Online
 In The Long Tail, Chris Anderson shows how much the shift from brick and mortar to internet stores increases selection and how much that increased selection accounts for in terms of sales (see chart).
Aside: As you can see in the graph from the July 8, 2008 edition of The Long Tail, Rhapsody has 4.5 million tracks, Netflix 90,000 DVDs and Amazon 5 million book titles. In the July 11, 2006 hard cover edition those numbers were 1.5 million, 55,000 and 3.7 million respectively and in the original October 2004 Wired article they were 735,000, 25,000 and 2.3 million. Amazing the increase in just 4 years.
But, after finishing the book I was still left with three questions.
First, how do you quantify the value to the consumer of this additional selection?
Second, how many titles account for the top and bottom 50% of sales in the brick and mortar stores and how much does that increase for internet stores?
Third, how long is the long tail? By which I mean did the top 1% of titles account for 5%, 20% or 40% of sales? Does this differ between books, music, and movies and if so, why? As the number of books, songs and movies created each year increases, does that change the shape of the long tail?
While I am still not sure of the answers to these questions, I was able to find a mathematical framework and estimate how long the long tail is. In the book The Black Swan, the author describes the Pareto power law distribution and gives some estimates of the exponent for certain phenomenon.
I have called for carbon labeling on all products and Apple has taken up the challenge. With their new MacBooks, they have released an environmental report (thanks to Earth2Tech for the pointer) that specifies how much CO2 is emitted in the production and use of the laptops.
Over the 4 year lifespan of a MacBook, it is responsible for 460 kg of CO2 emissions (115 kg per year). At 8.8 kg of CO2 per gallon of gasoline, that is equivalent to the emissions of 52 gallons (13 gallons a year). 115 kg is just .6% of the average American's 20,000 kg of co2 emissions a year.
As the chart shows, 50% of the life cycle emissions of a MacBook come from the production and manufacturing of the device (230 kg). Unfortunately there is no additional information as to what the main contributors to this value were.
Another 10% (46 kg) of the emissions come from the transportation of the laptop. That is the equivalent of 5 gallons of gasoline, which seems like a lot for a 10 lb device. I looked at one carbon offset program for shipping that assumed .08 lbs of co2 per ton mile shipped. At 1/200 a ton, this would mean that the laptop was shipped 253,000 miles or 32 times around the Earth. How far are they shipping these laptops?
39% (180 kg) of the emissions come from producing the electricity needed to run the laptop for 4 years (45 kg per year). Not clear what kind of assumptions they made for how many hours a day the laptop was operating or what the source of the electricity was.
One of the easiest ways for a consumer to reduce their carbon footprint is to wait longer before upgrading their computer. Using a MacBook for an extra year would bring the 5 year emission total to 510 kg (an addition of 45 kg), lowering the annual amount to 102 kg, a savings of 13 kg a year.
The yearly emissions of a MacBook are fairly similar to that of mobile phone based on this study that I looked at. The production of a mobile emitted 60 kg of CO2 and the usage another 52 kg for a total of 112 kg of CO2 a year (the study assumed that the phone is replaced after a year). That is almost identical to the 115 kg a year that using a MacBook generates.
The MacBook's co2 emissions equivalent to 52 gasoline gallons is a bit less than the 64 gasoline gallons of energy equivalent that a computer and monitor used over their lifetime based on this study I previously looked at (50 gallons for the manufacturing of the computer and 14 for the usage over 4 years). They aren't completely comparable as the other study just gives energy usage and not CO2 emissions.
I hope more computer manufacturers follow Apple's lead and publish the carbon footprint of the machines they manufacture.

Almost ten years ago, graduate students in the laboratory of physics professor Eric Mazur at Harvard University stumbled across a new way of making silicon more responsive: they found that if they blasted the surface of a silicon wafer with an incredibly brief pulse of laser energy in the presence of gaseous sulfur and other dopants, the resulting material—which they called “black silicon”—was much better at absorbing photons and releasing electrons.via Xconomy via Earth2Tech
These properties mean that SiOnyx is in a position to pioneer new types of solar cells that could capture the sun’s energy across a broader spectrum, achieving greater efficiency than today’s photovoltaic cells.
“Harnessing nuclear fusion energy arriving from Sol—solar energy at 1366 Watts per square meter—is the most promising technology for meeting accelerating world needs for cheap and clean energy,” says Polaris’s Metcalfe. Black siliicon “promises to dramatically increase the photo-response (Amps per Watt) of silicon, and not just in the visible spectrum, but also in the infrared, where silicon currently misses half of Sol’s energy. Delivering on that promise is very exciting.”
But that’s the “long shot” application for the material, Metcalfe acknowledges. Closer in is the possibility of major sensitivity improvements in imaging applications such as night vision, surveillance, digital cameras, and medical imaging. Saylor says that the company has negotiated strategic partnerships with two “industry leaders,” and though he won’t name names, he says one of them is active in the medical imaging area.
In Richistan, I wrote about a new political divide emerging among the wealthy. While most Lower Richistani’s ($1 million to $10 million in net worth) were voting Republican, most Middle-and Upper Richistanis (those worth $10 million plus and $100 million plus) were voting Democrat.What explains the difference?
More than three quarters of those worth $1 million to $10 million plan to vote for Sen. McCain. Only 15% plan to vote for Sen. Obama (the rest are undecided). Of those worth more than $30 million, two-thirds support Sen. Obama, while one third support Sen. McCain.
Among Lower Richistani’s, 88% cited tax policies as being “important” in making their decision. Only 11% cited the environment, 22% cited health care and 45% cited social issues.The merely rich are concerned mainly with accumulating more wealth and therefore see lower taxes as the most important issue. The really rich have so much money that they are no longer concerned about taxes and instead are focused on longer term issues about the health of the country. They are concerned about what the country will be like for their children and grandchildren and are therefore see social and environmental issues as the most important.
Among the Upper Richistani’s supporting Sen. Obama, tax policies ranked last, with only 16% citing them as important. “Social issues” ranked first, with “policies dealing with wars” ranking second (67%) and Supreme Court nominations and health-care issues ranking next.
Those politicians that spent more than $4 mil of their own money on campaign were Democrats 3 to 1. Those that spent more than $1 mil but less $4 mil, Republican 2 to 1.Put me in the very rich camp, well without the being really rich part. :)
Google.org's Clean Energy 2030 plan.
Those with sense of history may find it’s time to invest (don't miss this interactive chart of how this bear market compares).
Mexican marijuana cartels sully US national forests.
Bonobos no longer seen as the peace-loving primate.
Obama Is Campaigning on Xbox 360.
 Paul Collier writes in The Bottom Billion (a really good read by the way):
With a bit of imagination you can think of education as a form of wealth: in one of the ugliest phrases in economics, educated people are "human capital," so labeled because their skills are valuable.I disagree with Paul. "Human capital" as not one of economics ugliest phrases, but rather one of the most beautiful. Typically, one thinks of capital as machines or buildings. Enlarging the concept of capital to include human capital means that one can invest in people as well as things. For those capitalists that aren't concerned with the social benefits of greater education, the concept of human capital gives them an hardheaded reason to invest in it.
The biggest accomplishment I see in communities where girls become literate is profound—their hygiene improves dramatically, they tell me they only plan to have 2-3 children vs. their mother having 8-10 children, the infant mortality of children with literate mothers drops as the mothers are eager to seek out health care, and even the “networth” for a dowry for an educated girl in a rural village doubles and triples (example: An illiterate girl is “worth” about 5 goats or $300. An educated girl is “worth” at least $600 - $1000 in bride price).Apparently in remote regions of Pakistan the increase in human capital of educating a girl is valued at 5-11 goats. I wonder what kind of ROI that works out to for fathers allowing their daughters to go to school?
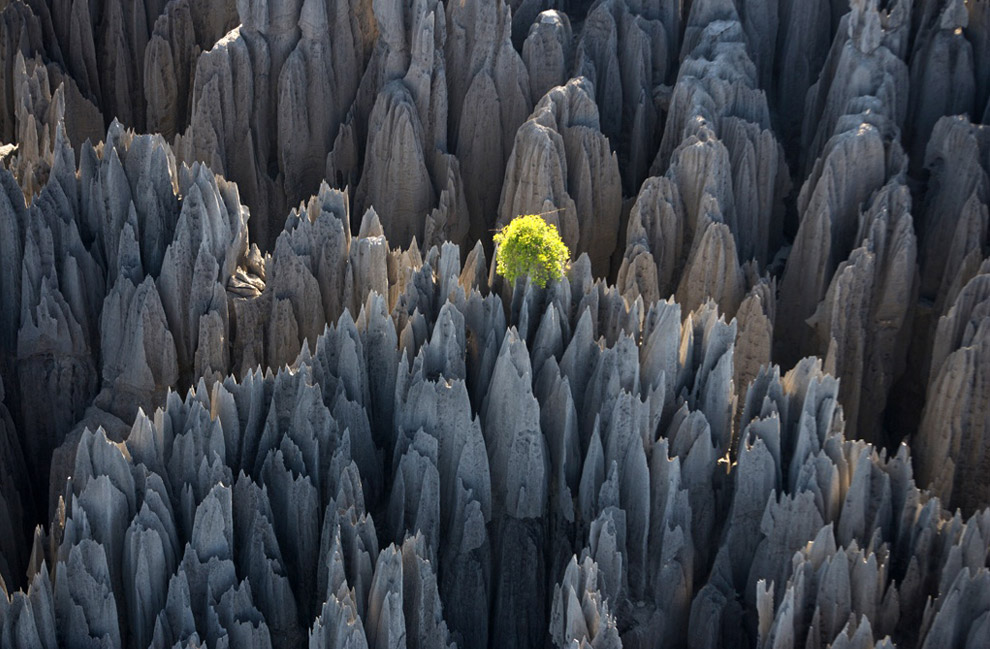
Tsingy of Bemaraha, Morondava region, Madagascar.Lots more stunning photographs here from photographer Yann Arthus-Bertrand courtesy of the Boston Globe's Big Picture.
Which regions of the world appropriate (use) the most amount of Net Primary Productivity (NPP) per person?
The type of statistics that ecologists and economists focus on and choose to ignore are contrary to each other. One focuses on total variety statistics and ignores total quantity statistics, while the other does the opposite. Economic statistics focus on total output and ignore amount of choices, while ecological statistics focus on biodiversity and ignore total amount of life. Both economic and ecological statistics give incomplete pictures because of what they are ignoring and could gain by putting more focus on the type of statistics the other discipline is capturing.
Ecological Statistics Ecological statistics focus on biodiversity: total number of species and number of species in danger of extinction. Recently I have come across all sorts of articles that report statistics on the number of species that are in danger of extinction: 16,928 total species, 48% of primates (and 80% in Asia), 20% of livestock breeds, 12% of birds, 23% of mammals, and 30% of amphibians.
But, there is little focus on statistics that measure the total amount of life on Earth or the size of species populations. Net primary productivity measures the total amount of biomass created each year and is one way to measure the total amount of life on Earth. This measurement gets little attention, even though unlike biodiversity, it has been increasing as of late. Statistics on species populations are also hard to find, although the Census of Marine Life is collecting some figures and hopefully the Encyclopedia of Life will display population information for each species.
It is important to put more emphasis on NPP and species population statistics to change the focus of ecologists from just preserving habitats of endangered species to also managing habitats to promote additional life on Earth. While I am all for preserving biodiversity hotspots, I would also like to see actions such as fertilizing the oceans, greening the deserts, using electricity and reef balls to increase the growth of coral, and better management of water resources to increase NPP. To paraphrase the economic quote 'a rising tide lifts all boats', rising NPP lifts all species populations. Increasing species populations is a good thing even if they aren't on the verge of going extinct. Beyond managing wilderness lands, ecologists should also promote improving farming techniques and research that will increase crop yields to minimize the amount of farm land needed and reduce the need to turn additional forest land into cropland.
The current high rate of extinctions makes scientists believe we are in the 6th mass extinction of the planet. Capturing information about the total amount of life will let us determine whether this mass extinction is like a nuclear holocaust where both the total amount of life and the number of species decreases, or if the world is experiencing a 'McDonaldization of ecosystems' where ecosystem around the world are converging on the same species (driving many species extinct), but each individual ecosystem is healthy and the amount of life on Earth stays constant.
Economic Statistics Economic statistics focus on total output statistics such as GDP. The goal is to try and increase GDP, allowing consumers to purchase more goods and services and raising the standard of living as measured by GDP per capita.
But, when it comes to statistics that measure the diversity of products available to consumers, I am unaware of any. I would like to see a statistic that measured how many different types of products the economy produced. How many types of TVs, refrigerators, cars, books, types of clothing, etc. are available to consumers? I would also like to see a regional metric that measured the amount of products available locally for consumers to choose from. How many restaurants are within a 5 mile radius? How many movies do the local video rental stores have to choose from? This metric would allow comparisons of product variety between different cities and between urban and rural areas.
It is important to collect statistics on the diversity of products because additional choice adds extra value to economies and extra utility to consumers. If two economies had identical GDPs, but one had more product variety, it would be richer. $100 is more valuable in an economy that has more options of how to spend it. Greater selection adds values in three ways: additional variety (ability to eat at a different restaurant for lunch every day), additional specificity (ability to find a computer that more closely meets your specific needs) and additional individuality (ability to find clothes that are different from what others have).
Amount of selection is particularly important with attention goods like movies, books and TV shows. With attention goods, you have a fixed amount of time to consume them (which makes time more valuable than money in the attention economy). The fixed amount of time make greater selection more valuable than additional goods (and raises questions of how to measure productivity in the digital age). This is the essence of the added value of the long tail. Put another way, a Netflix 3 DVD at a time subscription with a library of 100,000 movies is more valuable than a 4 DVD subscription with a 20,000 movie library.
Another way to reflect the value of extra purchase options would be to incorporate it into the GDP figure itself. An analysis by Christian Broda and David Weinstein estimates that US welfare is 3% higher due to increased purchase options from imported varieties. Real GDP could take into account greater purchase options if inflation captured this information. Currently this is not done, as pointed out in Misconceptions of the CPI:By the same token, an increase in product variety is a benefit to consumers that also is not accounted for by any CPI. The Boskin commission pointed to the increased variety of restaurants as an example of a consumer benefit that does not enter into the calculation of the CPI. The introductions of new classes of products such as MP3 players or DVD players are additional examples.
While converting extra selection into additional value in GDP allows for easier comparisons of economies across countries and time periods, information is lost when converted into a single GDP metric. Being rich and living in a rural area with few consumption choices is not the same as being a bit poorer and living in an urban area with lots of choices. Living in 2008 with 200+ TV channels to choose from is not the same as being slightly richer in 1978 with only 5 TV channels to choose from. For that reason, I believe statistics on the diversity of products available should be reported separately and accompany GDP.
Conclusion
If economic statistics had the same focus as ecological statistics we would worry about how many brands of jeans were available to purchase but ignore how many jeans consumers could actually buy. If ecological statistics had the same focus as economic statistics we would worry about trying to increase the population counts of species on Hawaii but ignore the 271 species that went extinct.
To get a more accurate picture of how the economy and the natural environment are functioning, statistics on both total output/amount of life and amount of choices/biodiversity are needed. While economic statistics focus on total output and ecological statistics focus on biodiversity, each discipline could gain from using some of the others techniques.
Roger Cohen writes:
When I taught a journalism course at Princeton a couple of years ago, I was captivated by the bright, curious minds in my class. But when I asked students what they wanted to do, the overwhelming answer was: “Oh, I guess I’ll end up in i-banking.”Paul Volcker says:
It was not that they loved investment banking, or thought their purring brains would be best deployed on Wall Street poring over a balance sheet, it was the money and the fact everyone else was doing it.
But why do freshmen bursting to change the world morph into investment bankers?
“I guess the bottom line is the money. You could be going to grad school and paying for it, or earning six figures. And knowing nothing about money, you get to move hundreds of millions around! No wonder we’re in this mess: turns out the best and the brightest make the biggest and the worst.”
According to the Harvard Crimson, 39 percent of work-force-bound Harvard seniors this year are heading for consulting firms and financial sector companies (or were in June). That’s down from 47 percent — almost half the job-bound class — in 2007.
"We need fewer financial engineers and more electrical and chemical engineers and civil engineers to take care of our infrastructure. Too much of our talent into the false castle of the financial world.Tom Friedman writes:
The market is now consolidating this industry, with the strong eating the weak, which will impose its own fiscal discipline. Good. Maybe then more of our next generation of math geniuses will think about going into engineering the next great global industry — energy technology — rather than engineering derivatives.I often wonder whether the US economy does a good job of allocating the resources of its best and brightest. Are they placed in positions where they can benefit society the most?

India's top computer scientists are feted around the world, yet most children in rural areas lack the basic education needed to find more productive work. Around half of all Indian women are illiterate, compared with a ratio of around one in seven in China.Democracy, shemocracy, if you can't educate your girls, what is the point? An educated populace is key to economic and world power in the 21st century, and with a female illiteracy rate that high, there is no way that India will be in the same ballpark as China.

A small group of Mexicans from the academic and private sectors has been trying to get an Agave-to-ethanol project up and running. High in sugar content, the project team estimates that varieties of Agave tequilana weber can yield up to 2,000 gallons of distilled ethanol per acre per year and from 12,000-18,000 gallons per acre per year if their cellulose is included, some 14 dry tons of feedstock per acre every year.The numbers seem really optimistic to me. If Agave could produce so much more sugar per acre than sugar cane, without any need for nitrogen fertilizers and with low water requirements, why aren't we producing sugar from it right now? I am skeptical that they can really get 2,000 gallons per acre per year or 2.5 times as much as sugar cane. But, even if they were just competitive with sugar cane, it seems like it would make sense given its ability to grown on semi-arid wastelands. It would also be much better than using corn, if their numbers are anywhere near accurate.
Corn ethanol, for example, has an energy balance ratio of 1.3 and produces approximately 300-400 gallons of ethanol per acre. Soybean biodiesel, with an energy balance of 2.5, typically can yield 60 gallons of biodiesel per acre while an acre of sugar cane can produce 600-800 gallons of ethanol with an energy balance of 8.0. An acre of poplar trees can yield more than 1,500 gallons of cellulosic ethanol with an energy balance of 12.0, according to a National Geographic study published in October 2007.
"High quality agaves are very good feedstock material for biofuel...for the following characteristics: high total sugar density and content; high weight of the fruit and stems; cultivation and harvest cycles of six years; high density of plants per hectare; genetic diversity and high adaptability, low water requirements; CO2 and capture; methane metabolism; soil retention; plant nutrition; products from inulin; and low maintenance during cultivation," Madrigal said.
"Our enhanced Agave tequilana weber variety plants have a sugar content of 27º to 38º Brix, [which is] 3-times sugarcane's and weigh around 300 kilos (660 pounds) each individual. But we've got plants from another agave species that weigh 1.2 metric tons each with sugar content around 25º Brix, double that of sugar cane. This means that annually per acre, we could easily get 5,000 gallons of distilled ethanol and fifty metric tons of dry biomass, with 33 metric tons of cellulose content."
According to Velez's calculations, 7 million hectares of the Agave-to-ethanol team's enhanced Agave tequilana weber variety could provide the entire 36 billion gallons of ethanol the U.S. government needs by 2022 to comply with the renewable fuel standard set forth in December of last year, as well as 250 million metric tons of the dry biomass it is aiming to obtain by 2017.
"Agave thrives in semi-arid wastelands — 50% of Mexico — needs no watering or agrochemicals, requires very scarce field labor and grows well in any type of soil, even highly degraded and steep terrains, because it takes nitrogen from the air. One-third of the world's habitable land is arid and semi-arid where agave can be cultivated. Some agave species accept temperature ranges from -14ºC to 50ºC," he said.
 Baacode is the very clever moniker that outdoor sports apparel company, Icebreaker, have given their superfine merino garment traceability program. Much touted over the past few months, Baacode was officially launched this week. For as of this month new garments will sport a barcode number on their labelling. Customers can type this code into a website search engine and it will take them on a tour of the New Zealand high country sheep station (ranch) where the merino wool came from.
I am always on the lookout for ways to better understand the backstory of my purchases and the social and environmental impacts of producing them. The Baacode is helpful in that regard. While the FAQ states that you can "meet the farmers and the living conditions of the sheep, then follow the fibre to the factories that knit, dye, finish, cut, manufacture and ship the garments", the demo that they provide only allows you to meet the farmers. Cool none the less.
As Icebreaker put it in their media release: “Customers will see the living conditions of the sheep, meet the high country farmers who run the sheep stations, and follow the production process that turns premium merino fibre into Icebreaker's exceptional, performance-driven garments.” Icebreaker founder and CEO says, "For us, sustainability is about transparency and being able to show the whole design for the business, which starts with the growers and continues through every step of the supply chain."

Hundreds of new marine species and previously uncharted undersea mountains and canyons have been discovered in the depths of the Southern Ocean, Australian scientists said Wednesday.It always amazes me how little we know about what is going on at the bottom of the ocean. Until we have mapped and explored all of the underwater world on Earth, I would redirect all the money going into exploring outer space and direct it here.
A total of 274 species of fish, ancient corals, molluscs, crustaceans and sponges new to science were found in icy waters up to 3,000 metres (9,800 feet) deep among extinct volcanoes, they said.
The scientists mapped undersea mountains up to 500 metres high and canyons larger than the Grand Canyon for the first time, the government's Commonwealth Scientific and Industrial Research Organisation (CSIRO) said.
The finds were made in marine reserves 100 nautical miles south of the Australian island of Tasmania during two CSIRO voyages in November 2006 and April 2007 using new sonar and video technology as well as seafloor sampling.
"They're really what we call the rainforests of the deep, they provide an area where we get a very wide range of species collected and that's really unique in the deep sea environment," he said.
In the cold depths of the Southern Ocean "things grow quite slowly so when you're looking at a coral which is maybe two metres high, it may also be 300 years old or more," said Bax.
Scientists said that only a tiny proportion of Australia's oceans had been explored in such a way and they could only speculate on the biodiversity hidden under the water.

The highly-automated factory belongs to Solyndra, a three-year-old company that has received $600 million in venture capital and $1.2 billion in orders for its new modules, which look like curtain rods. Those big investors are betting the company's unique product will soon blanket commercial buildings across the world.No word on what the cost of the electricity they produce is. Photos of the plant here.
Instead of the standard panels mounted on racks that have dominated solar for the last 20 years, Solyndra's cylindrical solar modules collect sunlight more efficiently across a broader range of angles and catch light reflected off the roof itself. The solar cells also contain no silicon, which has been a costly component of most solar systems. The solar tubes look like reverse fluorescent light bulbs that generate electricity rather than using it. The mounting system is also light and small, as you can see in the image.
Targeted at a highly specific market — office and big-box rooftops — and with signed contracts in hand, the company, along with a small cadre of other well-funded solar startups, are racing to turn their scientific and engineering marvels into profitable businesses.
A report released last week by Lux Research, a solar-focused analysis firm, predicts that the total solar market will grow from $33.4 billion in 2008 to $100.4 billion in 2013. While traditional silicon-based solar cells continue to underpin most solar systems, there is a broad expectation among industry analysts and insiders that these new thin-film solar cells, such as Solyndra is making, will experience rapid growth.
George Will writes:
Americans' saving habits are better than they seem because the very rich, consuming more than their current earnings, have a negative savings rate.That really surprised me as I thought that the rich were responsible for more of the saving in the economy.
The personal savings rate ignores the capital gains in our investments like stocks and bonds, and also tangible assets like cars and real estate.Seeking Alpha gives a great example of how that can lead to a misleading result.


 RSS Feed